Avviso
Dal 1° gennaio 2024 diventa operativa l'incorporazione di SOSE in Sogei, come previsto dalla legge n.112 del 2023 che ha disposto la fusione della società.
A tal fine tutte le comunicazioni Sose si trovano sul sito Sogei www.sogei.it.
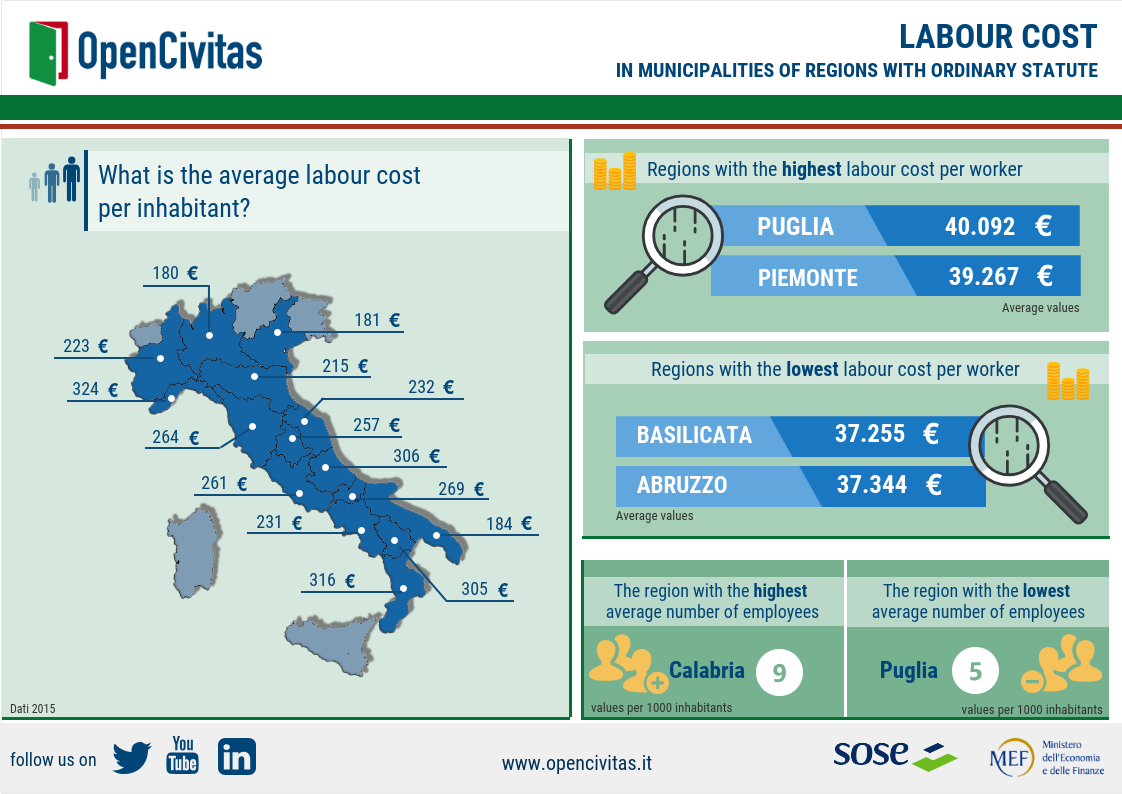
The infographic reports information on labour cost in municipalities of regions with ordinary statute.
Data refer to total functions considering 5,569 municipalities (amounting to 83.6% of the total) that present a non-anomalous labour cost, different from zero and not hidden for privacy.
The first part shows the average labour cost per inhabitant divided by regions.
- Piemonte - 222,830172
- Lombardia - 179,9441909
- Veneto - 180,8024366
- Liguria - 323,6648874
- Emilia-Romagna - 215,0168202
- Toscana - 263,7994469
- Umbria - 256,5482125
- Marche - 231,7608411
- Lazio - 261,2253904
- Abruzzo - 306,2182795
- Molise - 269,0667879
- Campania - 231,2743878
- Puglia - 183,5743607
- Basilicata - 304,688055
- Calabria - 315,6446143
The regions with the highest labor cost per worker (averange values) are Puglia with 40.092 euro and Piemonte with 39.267 euro while the minimum values occur in Basilicata with 37.255 euro and in Abruzzo with 37.344 euro.
Calabria is the region with the highest average number of employees per 1000 inhabitants about 9 units, Puglia that with the lowest average number about 5 units.
The infographic's data refer to 2015 annuality.
Further details on www.Opencivitas.it