Avviso
Dal 1° gennaio 2024 diventa operativa l'incorporazione di SOSE in Sogei, come previsto dalla legge n.112 del 2023 che ha disposto la fusione della società.
A tal fine tutte le comunicazioni Sose si trovano sul sito Sogei www.sogei.it.
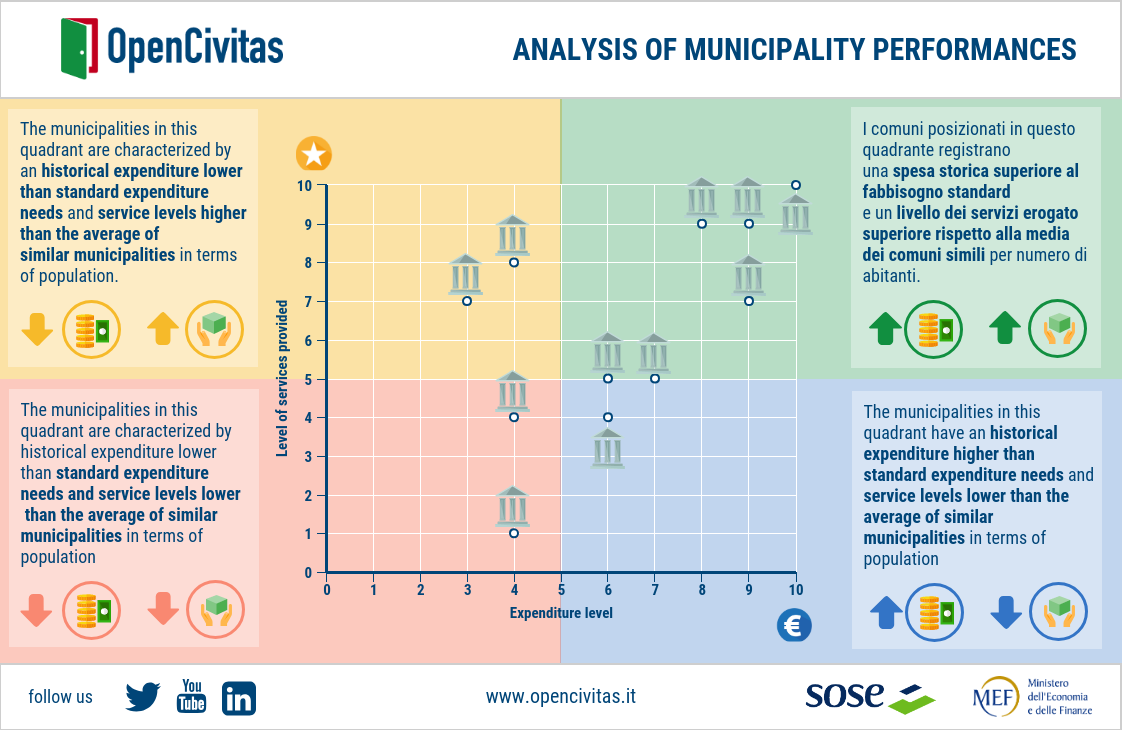
In order to analyse the capacity of municipalities to satisfy the demand of citizens for local services in relation to their expenditure management capacity and the services offered, two criteria were identified: the level of services (measured on a 0 to 10 scale) and the level of expenditure (measured on a 0 to 10 scale).
By aggregating this information on a Cartesian plane, represented by 4 quadrants, it is possible to analyse how municipalities are distributed on the basis of the above-mentioned criteria. The score 5 means that the municipality is in line with the services provided and the average level of expenditure incurred if compared with other similar municipalities.
First quadrant (top right) In this quadrant we find those municipalities that record a historical expenditure exceeding the standard expenditure need and a level of services provided higher than the average of the municipalities in the same population bracket.
Second quadrant (bottom right) Municipalities at the bottom right are characterized by a historical expenditure exceeding the standard expenditure needs and provide fewer services than the average of other similar municipalities in terms of number of inhabitants.
Third quadrant (bottom left) In the lower left quadrant there are the municipalities with historical expenditure lower than the standard expenditure need which provide fewer services than the average of other municipalities in the same population
Fourth quadrant (top left) the municipalities that are positioned upper left register historical expenditure lower than the standard expenditure need and level of services higher than the average of similar municipalities in terms of number of inhabitants.